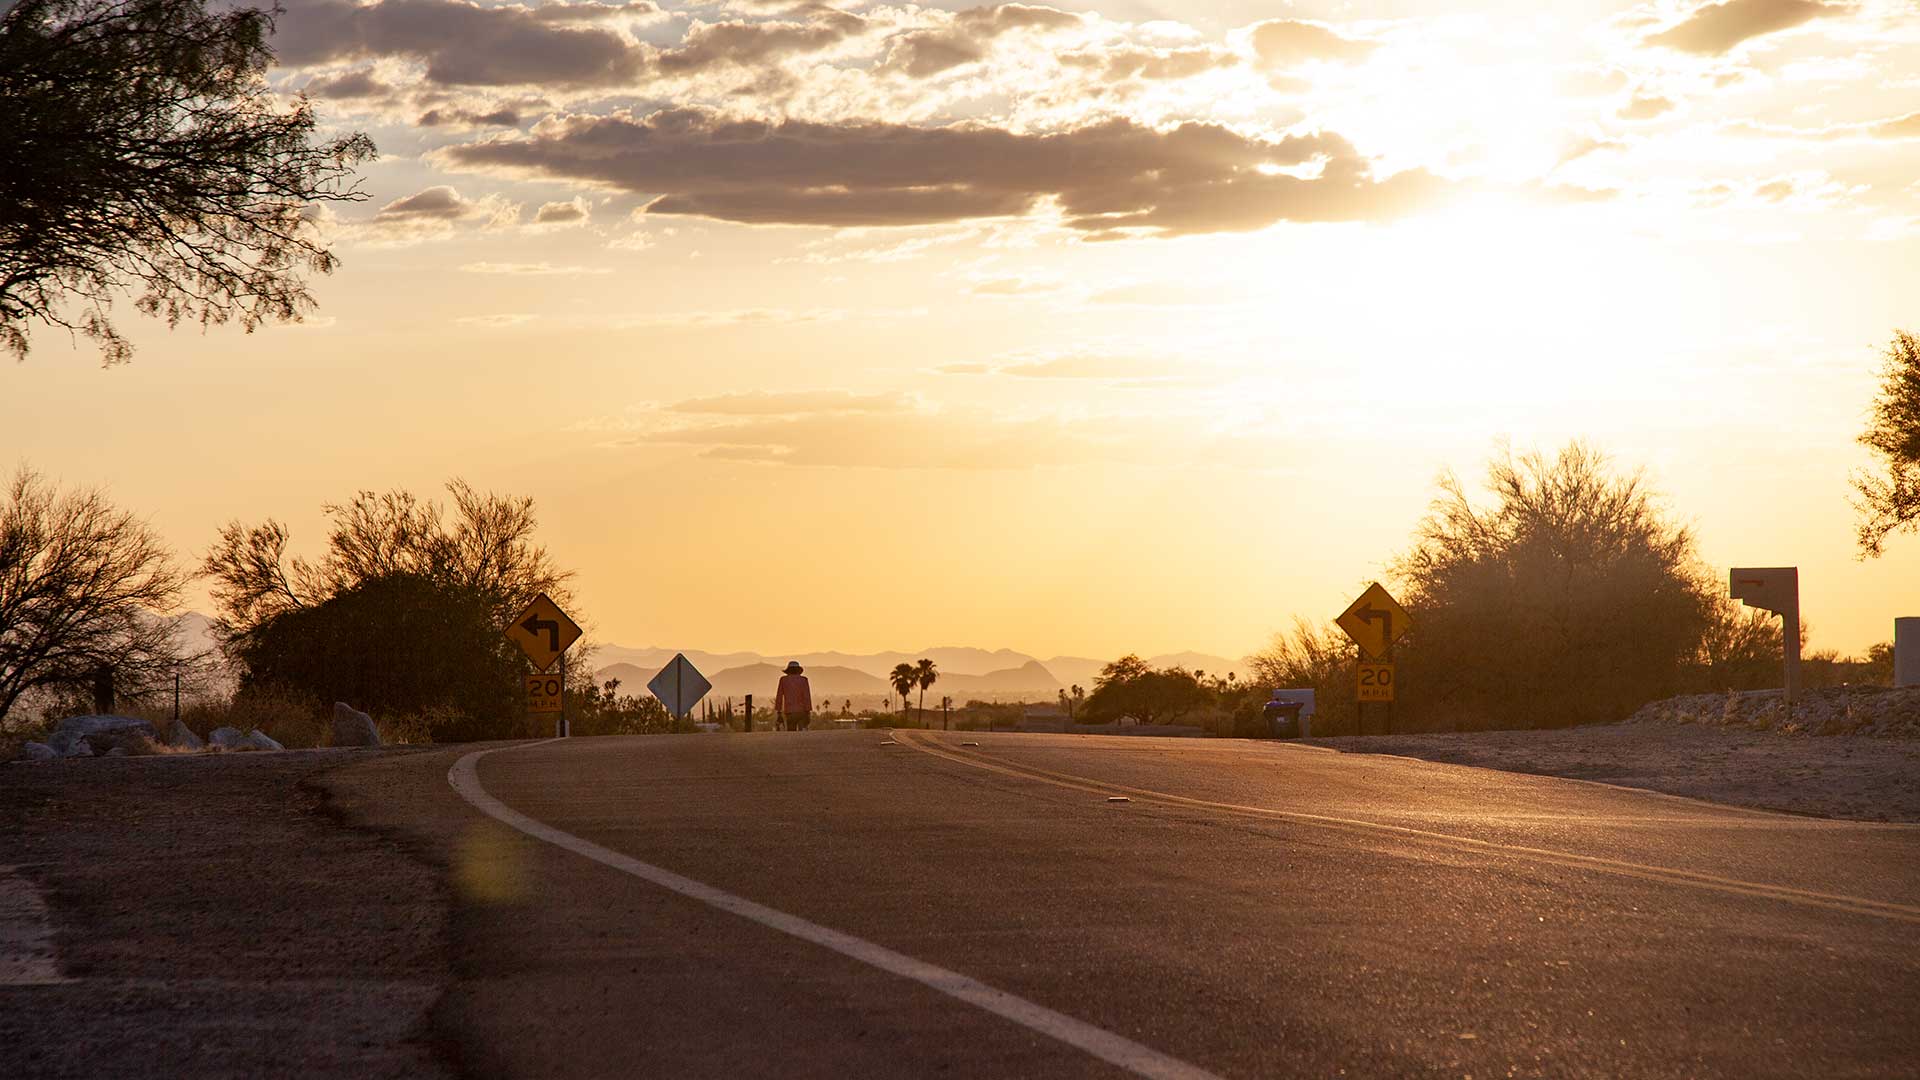
 The sun sets over Tucson in July 2020, which was the hottest July on record.
A new online dashboard that aims to give state and local governments the real-time information they need to fight climate change paints a bleak picture for Arizona’s future, calling for more heat, more drought, and more wildfires.
Phoenix Mayor Kate Gallego said it’s an important if grim, message.
“We are spending tens of millions of dollars on climate resilience … and this tool will help me understand where are the most effective places to put these dollars,” Gallego said Thursday.
Gallego joined Miami-Dade County Mayor Daniella Levine Cava and White House officials as the Biden administration unveiled the dashboard, known as the Climate Mapping for Resilience and Adaptation portal.
It was touted as part of the Biden administration’s efforts to help local governments “better understand current exposure to climate risks to strengthen their resilience plans,” according to a White House statement.
President Joe Biden ordered the development of a dashboard on Jan. 27, 2021, just a week after taking office. White House officials on the call unveiling the dashboard called it just part of the administration’s climate agenda, along with funding in the Bipartisan Infrastructure Law and the Inflation Reduction Act, as well as a number of executive orders and task forces aimed at climate change.
Experts took a better-late-than-never stance on the dashboard, which they hope will help local governments better target their climate policies.
Maya Golden-Krasner, deputy director of the Climate Law Institute at the Center for Biological Diversity, said the tool will enable local leaders to “get more bang for their buck” by directing resources to the areas most vulnerable to climate disasters.
In addition to real-time information, the dashboard lets users peek into the climate future for a given county, Census tract, or tribal. It provides early-, mid-, and late-century climate projections through 2099, with two scenarios for each time frame: One based on whether emission levels rise for the rest of the century and the other showing what might happen if emissions fall.
Users can also filter the projections between five different climate hazards: extreme heat, drought, wildfire, flooding, and coastal inundation.
While they appreciate the scope of the data, some experts worried that by placing the hazards in separate categories, the tool misrepresents how intertwined they all are.
“If you have a drought, you may well have a forest fire, and then you may have an air quality problem and you may damage the electric grid,” said Kathy Jacobs, director of the Center for Climate Adaptation Science and Solutions at the University of Arizona.
She said that the tool does provide a clear picture of the damage climate change can inflict on the nation, a picture she and others hope will spur people to action.
“It makes very quantitative conclusions about what the future is likely to look like in a high-emissions scenario, which hopefully is motivating,” Jacobs said.
But even in isolation, the numbers are jarring. For example, the higher-emissions scenario on the dashboard projects that Maricopa County could have an average of 122.4 days per year above 105 degrees between 2070 and 2099. By comparison, Phoenix in 2021 had 104 days above 100 degrees, according to the National Weather Service.
Projections also show that the risk of wildfire will increase across the state, predicting that the number of days with less than 0.01 inches of precipitation will increase. Maricopa County would experience 297.7 such dry days per year by 2099, compared to 285.5 on average between 1976 and 2005.
The launch comes as Arizona is gripped by a range of extreme weather events. Extreme heat continues to hammer the state and a 22-year drought, considered to be the most severe in 1,200 years, has led to historically low water levels on the Colorado River, among other effects.
“We see impacts on a daily basis in our community,” Gallego said. “It shows up in terms of drought, intense moments of heat as well as flash flooding.”
By submitting your comments, you hereby give AZPM the right to post your comments and potentially use them in any other form of media operated by this institution.